Algorithm Visualization Tool
Interactive Graph Algorithm Visualizer
Category
Web Development & Education
Year
2024
Client
Educational Tool
Role
Frontend Developer
The Challenge
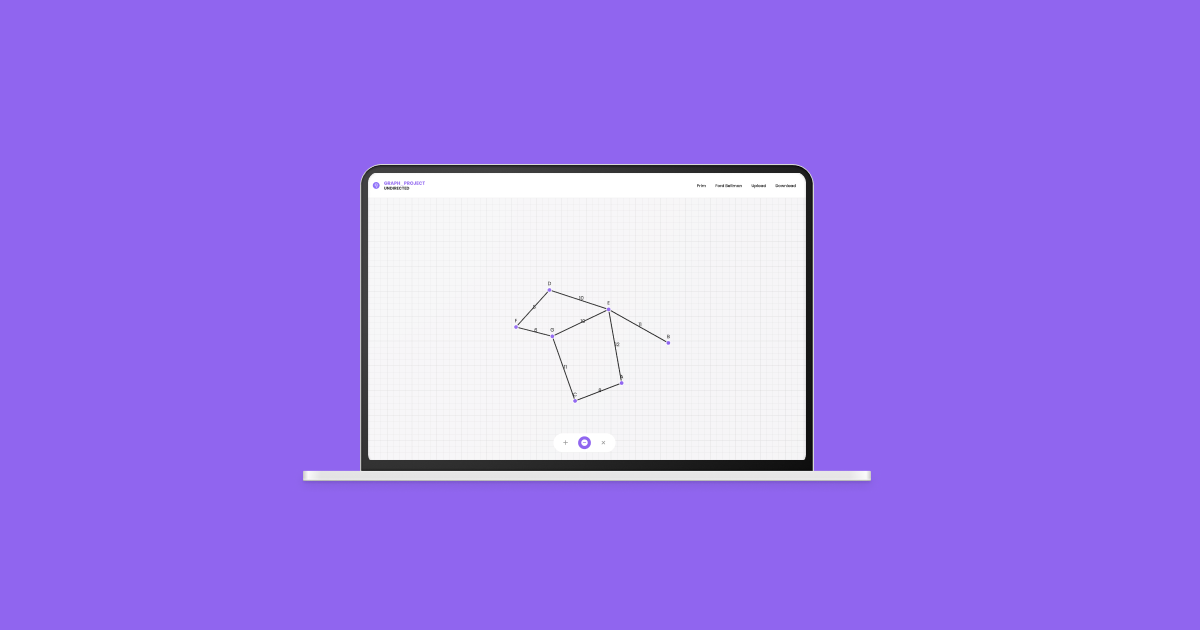
Students learning graph algorithms struggle to understand complex concepts like Prim's and Ford-Bellman algorithms. The challenge was to create an intuitive tool that visualizes these algorithms step-by-step with interactive graph creation and manipulation.
The Solution
Developed a web-based visualization tool using HTML/CSS, JavaScript, and D3.js library for interactive graph rendering. Implemented features for creating directed and undirected graphs with drag-and-drop nodes, step-by-step algorithm visualization, and graph import/export as text files for enhanced usability.
The Result
Successfully created an educational tool that helps students understand graph algorithms through interactive visualization. The tool supports custom graph creation, real-time algorithm execution with step-by-step breakdown, and data persistence through file import/export.
Project Gallery